
Speed of Service Audit Software for Faster Orders and Better Guest Flow
Measure queue, order-taking, payment, kitchen ticket, pickup, drive-thru, takeaway, and delivery handoff times with verified mobile audits—and close the bottlenecks slowing each outlet.
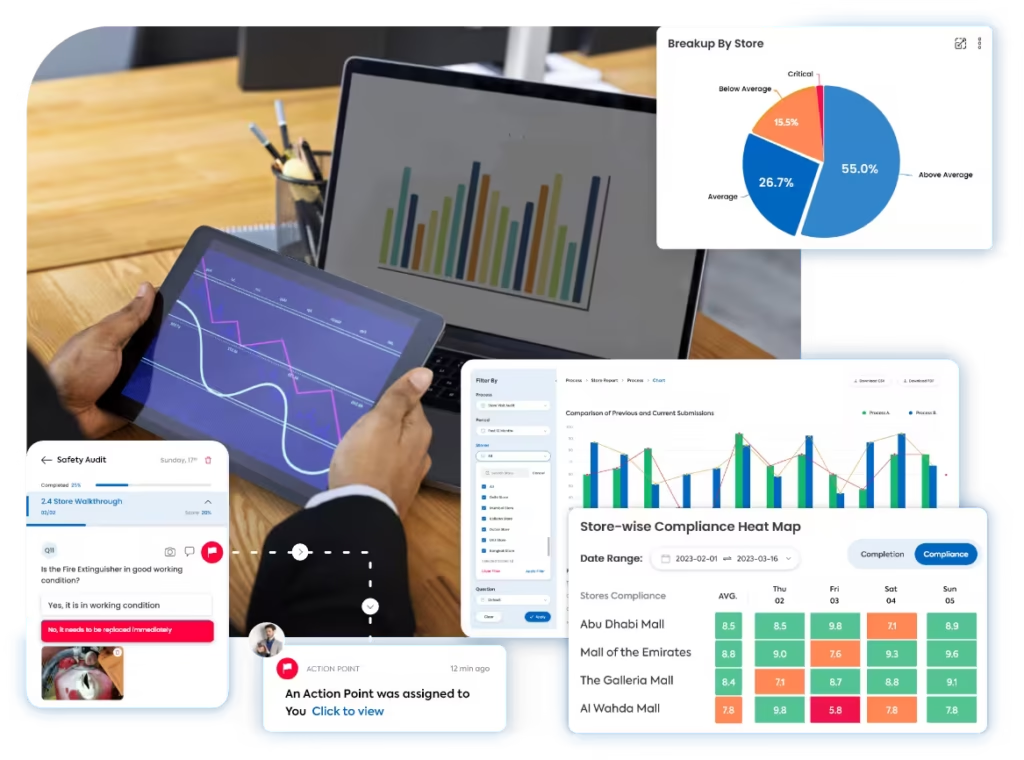
A clearer way to find and fix service bottlenecks across every outlet
Taqtics connects service standards, mobile timing observations, channel-level evidence, SLA scoring, reports, and corrective actions for restaurants, QSRs, cafés, cloud kitchens, food courts, drive-thrus, and delivery operations.
Where manual speed of service audits break down
Select a common gap to see why disconnected timing sheets hide the true bottleneck and delay operational follow-up.
A total service time does not show where the delay happened
Queue, order entry, payment, preparation, assembly, pickup, and handoff need separate observations to reveal the actual constraint.
Faster service is not useful when the order is wrong
Incorrect items, missing modifiers, packaging errors, and unclear handoffs can improve the timer while damaging the guest experience.
The same staffing and station bottlenecks repeat every peak period
Weak prep readiness, product availability, POS performance, equipment downtime, and role allocation can create predictable daily delays.
HQ cannot compare outlets, channels, shifts, and delay causes
Without one dashboard, slow outlets, repeat SLA breaches, drive-thru queues, rider waits, and overdue actions remain fragmented.
What a Speed of Service Audit Should Cover
Move through five coverage areas to review guest arrival, order capture, payment, kitchen execution, pickup, drive-thru, delivery, peak readiness, order accuracy, and recovery.
Guest arrival, queue movement, and service access
Measure how quickly guests enter the service flow and whether staffing, counters, menus, and routing keep the line moving.
Order capture, confirmation, billing, and payment
Verify that orders are entered correctly and payments are completed without avoidable POS or communication delays.
Kitchen ticket time, preparation, and assembly
Review the back-of-house stages that determine whether an order moves from ticket to completed item within its target.
Pickup, drive-thru, takeaway, and delivery handoff
Compare service channels and verify that completed orders reach guests or riders quickly and clearly.
Order accuracy, rush readiness, and service recovery
Protect the guest outcome by confirming speed, completeness, communication, and accountable response when a target is missed.
How Taqtics Digitizes Speed of Service Audits
Set timing standards once, schedule observations by outlet and channel, capture verified service data on mobile, compare SLA performance, and turn delays into accountable improvement.
Make Every Service-Time Observation Easier to Trust
Verify the outlet, channel, shift, service stage, measured time, order accuracy, evidence, score, and follow-up behind every finding.
Was the order handed over within the approved service-time target?
Enter total time and select the primary delay reasonWas the order complete and accurate at handoff?
Was the pickup counter clear and order staging organized?
Validated observations
Confirm where, when, in which channel, and with what evidence each service-time observation was submitted.
Validated observations
Confirm where, when, in which channel, and with what evidence each service-time observation was submitted.
- Geo-fenced and shift-based submissions
- Queue, order, prep, payment, pickup, and handoff time fields
- Channel, delay-reason, accuracy, photo, and comment evidence
- Timestamped outlet-level service audit trail
Standardized scoring
Apply common SLA thresholds, stage weights, channel rules, accuracy checks, and scoring logic across outlets and shifts.
Standardized scoring
Apply common SLA thresholds, stage weights, channel rules, accuracy checks, and scoring logic across outlets and shifts.
- Target-time and pass/fail thresholds
- Service-stage and channel-specific scoring
- Order-accuracy and guest-communication checks
- Automated outlet SLA score calculation
Corrective actions
Assign queue, POS, kitchen, assembly, pickup, drive-thru, rider-wait, accuracy, or recovery failures and track them to closure.
Corrective actions
Assign queue, POS, kitchen, assembly, pickup, drive-thru, rider-wait, accuracy, or recovery failures and track them to closure.
- Owners, priorities, and service-improvement deadlines
- Escalations for repeated SLA breaches
- Closure evidence and status tracking
- Recurring-delay and root-cause visibility
Connect audits with corrective action tracking software so service delays are not left unresolved.
Run Different Audits for Different Service Bottlenecks
Speed of service is not one checklist. Run targeted programs for guest arrival, counter and drive-thru flow, kitchen execution, delivery handoff, peak readiness, accuracy, and service recovery.
Peak-Hour Readiness Audits
Staffing, station allocation, prep completion, product holding, backup stock, equipment, packaging, and manager control before rush periods.
Kitchen and Station Readiness Audits
Ticket flow, mise en place, batch availability, cooking capacity, assembly readiness, equipment uptime, and expeditor coordination.
Counter Service Timing Audits
Queue wait, greeting, order entry, payment, kitchen ticket, pickup, total handoff time, order accuracy, and guest communication.
Drive-Thru and Handoff Audits
Menu board, speaker, payment window, pickup window, lane movement, aggregator readiness, packaging, rider wait, dispatch, and missed-pickup reasons.
Order Accuracy and Recovery Audits
Correct items, modifiers, sauces, sides, packaging, labels, delay communication, apology, remake handling, manager escalation, and guest recovery.
Delay Action and Follow-Up Audits
Root cause, owner, deadline, escalation, training need, equipment fix, workflow change, follow-up observation, closure proof, and recurrence prevention.
Speed of Service Reports That Reveal the Real Bottleneck
Turn service observations into outlet, shift, channel, and stage-level visibility across SLA performance, wait times, accuracy failures, repeat delays, and corrective actions.
View all report insights
- Average queue, order, payment, preparation, pickup, and handoff time
- Outlet, shift, daypart, and channel comparisons
- Order-accuracy and service-recovery trends
- Peak-hour bottleneck and station-level issue patterns
- Drive-thru window and delivery-rider wait reports
- Open, overdue, and closed corrective actions
- AI-based recurring pattern detection from historical timing data
Start With a Ready-to-Use Speed of Service Audit Checklist
Use structured templates to define queue, order, payment, ticket-time, drive-thru, delivery handoff, accuracy, SLA, delay-reason, scoring, and corrective-action requirements.
See How Multi-Location Teams Improve Service Execution
Explore how restaurant, café, QSR, and food-retail teams use Taqtics to standardize audits, improve outlet execution, compare location performance, track service gaps, and strengthen operational visibility.
Americana Group — KFC Middle East
How Americana digitized quality, food-safety, supplier, and OHS audits across KFC outlets, commissaries, and warehouses while accelerating corrective action.

Barns Café Operational Transformation
How Barns Café replaced paper SOPs and scattered follow-ups with digital checklists, audits, issue routing, training, and asset control across 1,000+ outlets.


Global Supermarket Chains
How supermarket teams digitized store audits, multi-level reviews, corrective actions, inventory checks, planogram execution, and leadership dashboards.
Speed of Service Audit Software Questions
What is speed of service audit software?
Speed of service audit software helps restaurant and QSR teams measure queue, order-taking, payment, kitchen preparation, pickup, drive-thru, takeaway, delivery handoff, order accuracy, and corrective actions across outlets.
What should a speed of service audit include?
It should include queue time, order entry, payment, ticket time, preparation, assembly, pickup, drive-thru, delivery handoff, order accuracy, rush readiness, delay handling, and action-plan closure.
Can Taqtics be used for drive-thru speed audits?
Yes. Taqtics can capture menu-board wait, speaker greeting, order confirmation, payment-window time, pickup-window time, lane movement, order accuracy, and total vehicle service time.
Can Taqtics track order accuracy with service time?
Yes. Audits can verify the correct items, modifiers, sides, sauces, drinks, packaging, labels, receipts, and special requests alongside the measured service time.
Can failed speed checks create corrective actions?
Yes. Failed queue, POS, kitchen, pickup, drive-thru, delivery, accuracy, or recovery checks can create actions with owners, priorities, deadlines, escalations, and closure proof.
Can Taqtics compare outlets, channels, shifts, and dayparts?
Yes. Reports can compare service SLA scores and stage times by outlet, region, shift, daypart, counter, drive-thru, takeaway, and delivery channel.
Make Every Speed of Service Audit Reliable and Actionable
Digitize timing audits, verify service stages and order accuracy with evidence, identify bottlenecks in reports, and close improvement actions faster across every outlet.